What Is SigNoz? Key Characteristics and Self-Hosting Approach from an OpenTelemetry Perspective
Why SigNoz is worth considering in an OpenTelemetry-based observability stack, and how to approach self-hosting it with Docker or Kubernetes.
Korean version: SigNoz란 무엇인가? OpenTelemetry 관점에서 보는 특징과 셀프 호스팅 방법
Once you start learning OpenTelemetry seriously, you eventually run into the same set of questions.
- how should telemetry be collected?
- where should the Collector live?
- where can traces, metrics, and logs be viewed together?
- should you assemble Grafana, Jaeger, Prometheus, and Loki separately?
- or is there a tool that gives you a more integrated starting point?
One of the tools that often appears at that point is SigNoz.
That does not mean it is automatically the right answer for every team. But it is absolutely a reasonable option to evaluate if you want an OpenTelemetry-friendly observability tool that can also be self-hosted.
This post looks at what SigNoz is, why teams may want to consider it, and how to think about self-hosting it in a practical way.
Quick summary
The most important things to know about SigNoz are:
- it is an OpenTelemetry-friendly observability platform
- it aims to make traces, metrics, and logs easier to follow together
- its self-hosted starting point is relatively approachable
- it can be a good choice when you want to avoid over-fragmenting the initial observability stack
That makes it worth evaluating, especially for teams building an observability stack from scratch.
Why SigNoz is worth looking at
1. It fits naturally with OpenTelemetry-first thinking
SigNoz aligns well with OpenTelemetry-based telemetry flows.
That means a structure like this feels natural:
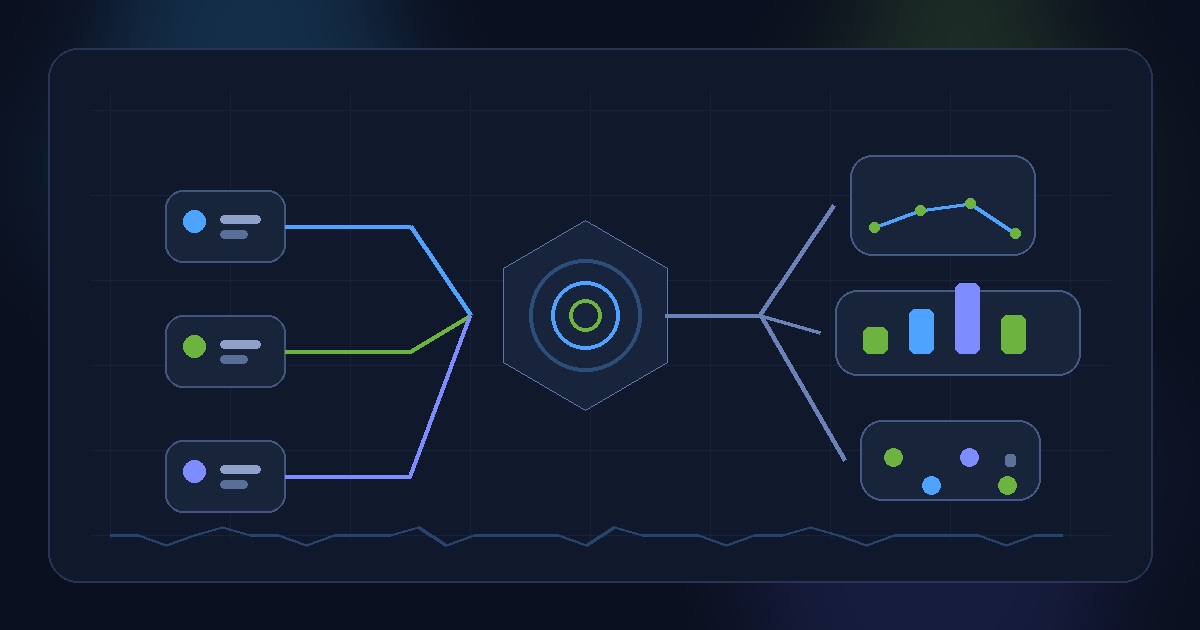
- applications generate telemetry
- collectors receive and process it
- traces, metrics, and logs can be explored in one connected flow
As more teams move toward OpenTelemetry as a standard rather than vendor-specific instrumentation, this kind of alignment becomes increasingly useful.
2. It reduces the burden of manually stitching together many separate tools
A common observability stack often looks like this:
- traces in Jaeger
- metrics in Prometheus
- dashboards in Grafana
- logs in Loki or ELK
That stack is powerful, but it also creates a lot of operational and cognitive overhead, especially early on.
Teams have to think about:
- which data lives where
- how systems connect
- where people should look first during incidents
- how to keep the stack understandable over time
SigNoz tries to reduce that overhead by offering a more integrated user experience.
3. Self-hosting is relatively accessible
According to its official documentation, SigNoz provides both Docker standalone and Kubernetes installation paths.
That is useful because the adoption path can be gradual:
- try it locally or on a single server first
- validate the OTLP flow and UI behavior
- then move toward a more production-oriented Kubernetes setup
4. It can prevent observability from becoming “too complicated too early”
A stack that is too fragmented too early often ends up underused.
If the team cannot quickly answer:
- where should I look?
- what tool is responsible for what?
- how do traces, metrics, and logs connect?
then the platform may exist without becoming part of daily operations.
SigNoz can be a good fit when the goal is to get to a usable, connected observability experience faster.
That said, SigNoz is not always the best choice
Even in a positive review, this part matters.
SigNoz may fit well when:
- you want an OpenTelemetry-centered observability stack
- you want to self-host
- you want traces, metrics, and logs to feel more unified
- you do not want to assemble many separate tools immediately
SigNoz may fit less well when:
- you already have a strong Prometheus / Grafana / Tempo / Loki setup
- your organization already standardized on a different vendor APM platform
- your team already runs a mature, finely tuned observability stack
So SigNoz is not “always best.” It is better understood as a well-balanced option for certain teams and stages.
How to start self-hosting SigNoz
The easiest starting point in the official documentation is Docker standalone.
1. Docker standalone installation
The standard setup path is based on Docker Compose.
A typical flow looks like this:
1
2
3
4
git clone -b main https://github.com/SigNoz/signoz.git
cd signoz/deploy/
cd docker
docker compose up -d --remove-orphans
This approach is especially useful for:
- local testing
- proof-of-concept environments
- small internal evaluation setups
Pre-installation checks
Official guidance highlights a few practical requirements:
- Linux or macOS environment
- Docker and Docker Compose available
- at least 4 GB of memory allocated to Docker
- ports such as
8080,4317, and4318available
With that in place, it becomes fairly quick to bring the UI up and validate the first telemetry flow.
What to verify after installation
After startup, the main things to confirm are:
- containers are healthy
- the UI is reachable at
http://localhost:8080or the relevant server address - OTLP endpoints on
4317and4318are reachable for telemetry ingestion
Components such as collector, query-service, and storage-related services need to start correctly for the stack to work as expected.
What about Kubernetes?
If the target environment is Kubernetes, Helm-based deployment becomes the more natural path.
SigNoz provides dedicated Kubernetes installation documentation, including platform-oriented guidance for environments such as AWS, GCP, AKS, local clusters, and Argo CD flows.
Advantages in Kubernetes
- better alignment with production infrastructure
- easier scaling and separation of concerns
- more structured control over collectors, OTLP ingestion, and backend services
Things to watch out for
- starting directly with Kubernetes can increase the learning curve
- storage, retention, networking, and resource planning matter more immediately
- for early learning, Docker standalone is often the safer first step
A practical sequence is usually:
- validate the flow with Docker Compose
- verify telemetry ingestion and the UI
- move to Kubernetes or Helm once the team understands the architecture better
How to think about the OpenTelemetry flow with SigNoz
Even when using SigNoz, the real key is still the telemetry path itself.
A simple model looks like this:
- application generates telemetry (through Java Agent, Micrometer + OTLP export, or manual instrumentation)
- OpenTelemetry Collector receives and processes it
- SigNoz stores and visualizes it
That separation is useful because:
- applications remain less tightly coupled to the backend
- collector policies such as batching, retrying, and filtering stay centralized
- changing backend strategy later becomes easier
A practical adoption sequence
If I were introducing SigNoz to a team, I would usually recommend this order:
Step 1. Bring up SigNoz locally or on a single server
Make sure the UI and the general architecture are visible and understandable.
Step 2. Connect one Spring Boot service
Use a realistic path such as:
- Java Agent, or
- Micrometer plus OTLP export
Then verify that traces and metrics really appear.
Step 3. Improve Collector configuration
Only after the basics work, start refining things such as:
- batching
- memory limits
- attribute enrichment
- sampling strategy
Step 4. Move toward production-grade structure
At that point you can consider:
- Kubernetes
- Helm
- retention policies
- storage planning
- resource sizing
When SigNoz is especially worth evaluating
- when you want to understand OpenTelemetry through a hands-on backend
- when a Jaeger / Prometheus / Grafana / Loki combination still feels heavy
- when you want a self-hosted observability platform with a relatively approachable entry point
- when you want a connected experience across traces, metrics, and logs
Final thought
SigNoz is not a universal answer for every observability problem. But it is a strong and practical candidate for teams that want an OpenTelemetry-friendly, self-hostable observability platform without starting from a highly fragmented stack.
In that sense, its real value is balance:
- approachable enough to start with
- structured enough to learn from
- flexible enough to grow with
For teams in that stage, SigNoz is absolutely worth evaluating.